FREE Code 3 American Mission Brief
The Truth - 25 Yr. Real Performance of the S&P 500
Full report designed to help you see how the index performed from October 1999 - October 2024 in real terms. The results are shocking to say the least!
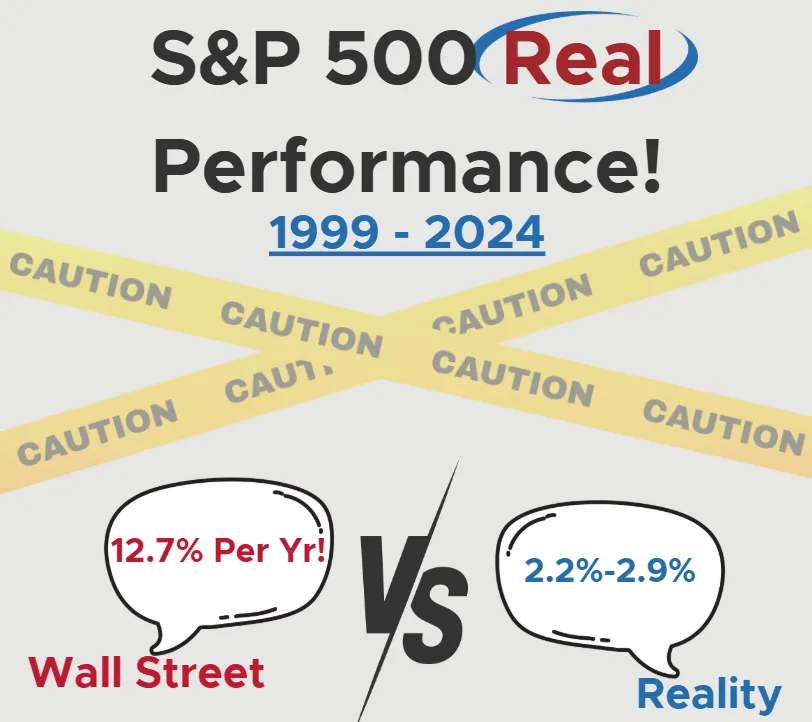
At first glance, it appears the index produced
over 12% returns; however, upon closer examination the real purchasing power gains were under 3%!
See why the Wall Street marketing machine never talks about REAL increases in purchasing power. This report looks past the smoke screen and shows the math! The report includes:
Difference in real financial returns & nominal returns
After tax
After fees
Inflation adjusted
Adjusting for time invested
Wall Street has morphed into a cash flowing casino
Mathew McConaughey movie clip explaining the rigged system in 1 min 45 seconds!
See the math
Quarter century sample size!
See an excerpt from the report below!
Report Excerpt
Real terms represents real increases in purchasing power. This means after adjusting for inflation, taxes and fees, how much more real world purchasing power would we gain just by holding one unit of the (S&P 500) index from 1999 - 2024. This report will simulate one unit
of the index being held in a mutual fund which may or may not be housed within a 401(k) retirement plan.
This removes the sales pitches, fancy terms, compound interest claims, etc. that Wall Street uses in their marketing. The power of compound
interest is certainly real, but this is largely a product of human discipline to keep contributing more money each month. Any investment can be compounded by reinvesting earnings forward, but this does not illustrate the true stand alone performance of an investment product.
Here’s an example to illustrate the point. An investor may invest $100 and earn $3 on the original investment in one year. The investor now
has a choice to either harvest or reinvest the earnings. If the earnings are reinvested, the investor is now earning say 3% on $103; however, in this example the investment is still only producing a net return of 3% no matter how many years the cycle is repeated.
+Much More Inside!

The Code 3 American™ mission is to enrich humanity and preserve the best country the world has ever known...this is why we share so many free resources - so you can go further faster!
Receive our free S&P 500 - 25 Yr. Real Returns report today and also gain free access to the exclusive Code 3 American Community team room. See you inside! Team's UP!
The information collected above will be processed in accordance with Code 3 Assets, LLC Privacy Policy and Terms of Use.
The information collected above will be processed in accordance with Code 3 Assets, LLC Privacy Policy and Terms of Use.